PowerGrow in Action
We wanted perform an experiment to show how well PowerGrow performs compared to one of the leading competitors. For this demonstration, various aroid plant samples were selected to measure the effects of PowerGrow against a competitor liquid fertiliser. In order to minimise other variables such as light and temperature, a control group was introduced. We were careful to select plant samples that were as identical as possible.
THE DETAILS
-
This experiment lasted approximately 3 months
-
We’re testing the effectiveness of PowerGrow when compared with a leading competitor when following the manufacturers instructions. A control group using only water was added for comparison.
-
The plant samples we chose for all 3 groups are
Philodendron Gloriosum
Philodendron Florida Ghost
Philodendron Plowmanii
Syngonium Pink Splash
Syngonium Aurea (Yellow Variegation)
Monstera Thai Constellation
Monstera Esqueleto
Anthurium Moodeanum
Anthurium Crystallinum
Epipremnum “Marble”
All of these plants were chosen to be of a similar size and root mass to each other. The number of leaves were also consdered.
-
All plants were subject to the same lighting, airflow and temperature conditions throughout the experiment.
First, we collected 3 samples of each plant.
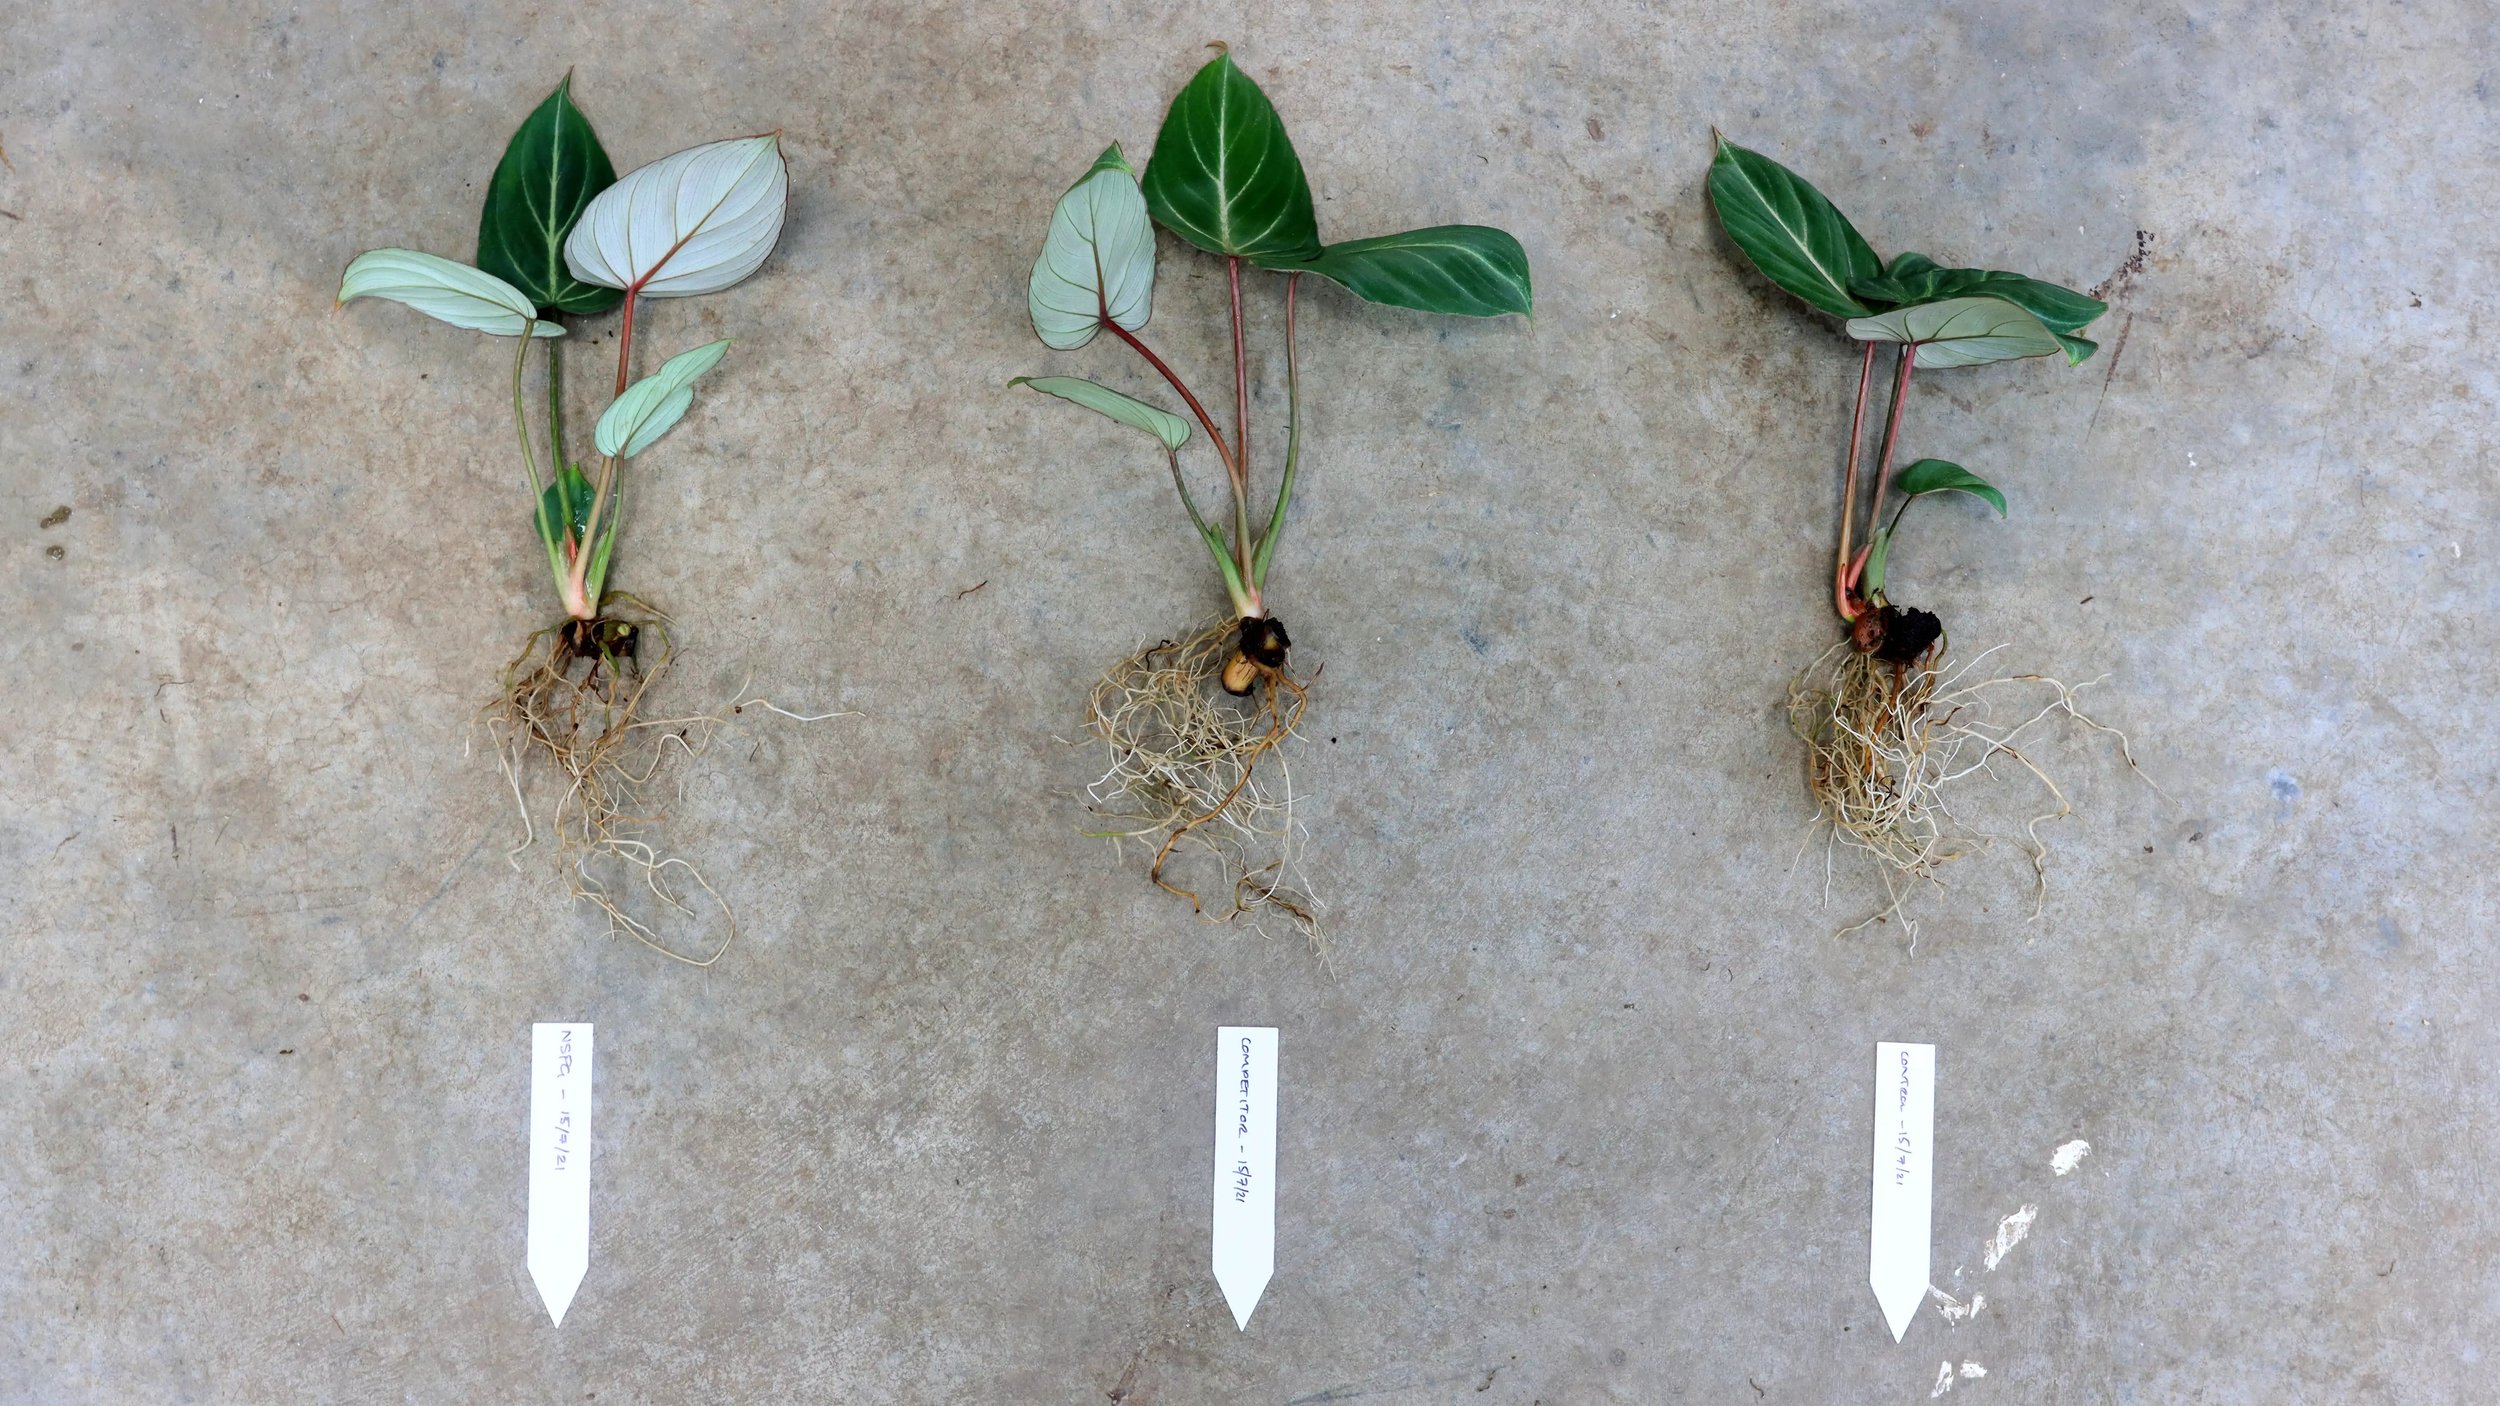
For this experiment, factors such as plant size, number of leaves and root mass were carefully considered in order for the 3 test groups to contain equivalent sample sizes. Here are 3 samples of Philodendron Gloriosum.
For the avoidance of any doubt in the selection of PowerGrow and Competitor samples, we chose the plants with the comparatively smaller root system to represent PowerGrow - Just to make sure!
The plants were potted into Leca (Lightweight expanded clay aggregate) and placed into their corresponding groups inside individual containers, and grown in identical conditions, such that the light and temperature was the same across all 3 groups. The 3 groups for this experiment are:
NSPG (NurtureSystem PowerGrow)
Leading Competitor Fertiliser
Control
Using Leca would ensure that the plant samples could not obtain any nutrients from the substrate itself. Using a household potting mix would have prevented us from being able to accurately observe the effects of the fertiliser on the plant samples.
Now, all we had to do was wait!
The plants were flushed and re-fertilised every 2-3 weeks throughout the duration of the test. Any change in conditions in the environment would affect all 3 groups in exactly the same way. The only thing left to do was to wait for the samples to show signs of growth.
We wanted to include samples of plants such as Syngonium, Philodendron, Monstera, Anthurium and Epipremnum in order to test PowerGrow on a range of popular houseplants. We also made sure that some of our houseplant choices were variegated plants, in order to further observe the effects of PowerGrow and the Competitor fertiliser.
THE RESULTS!
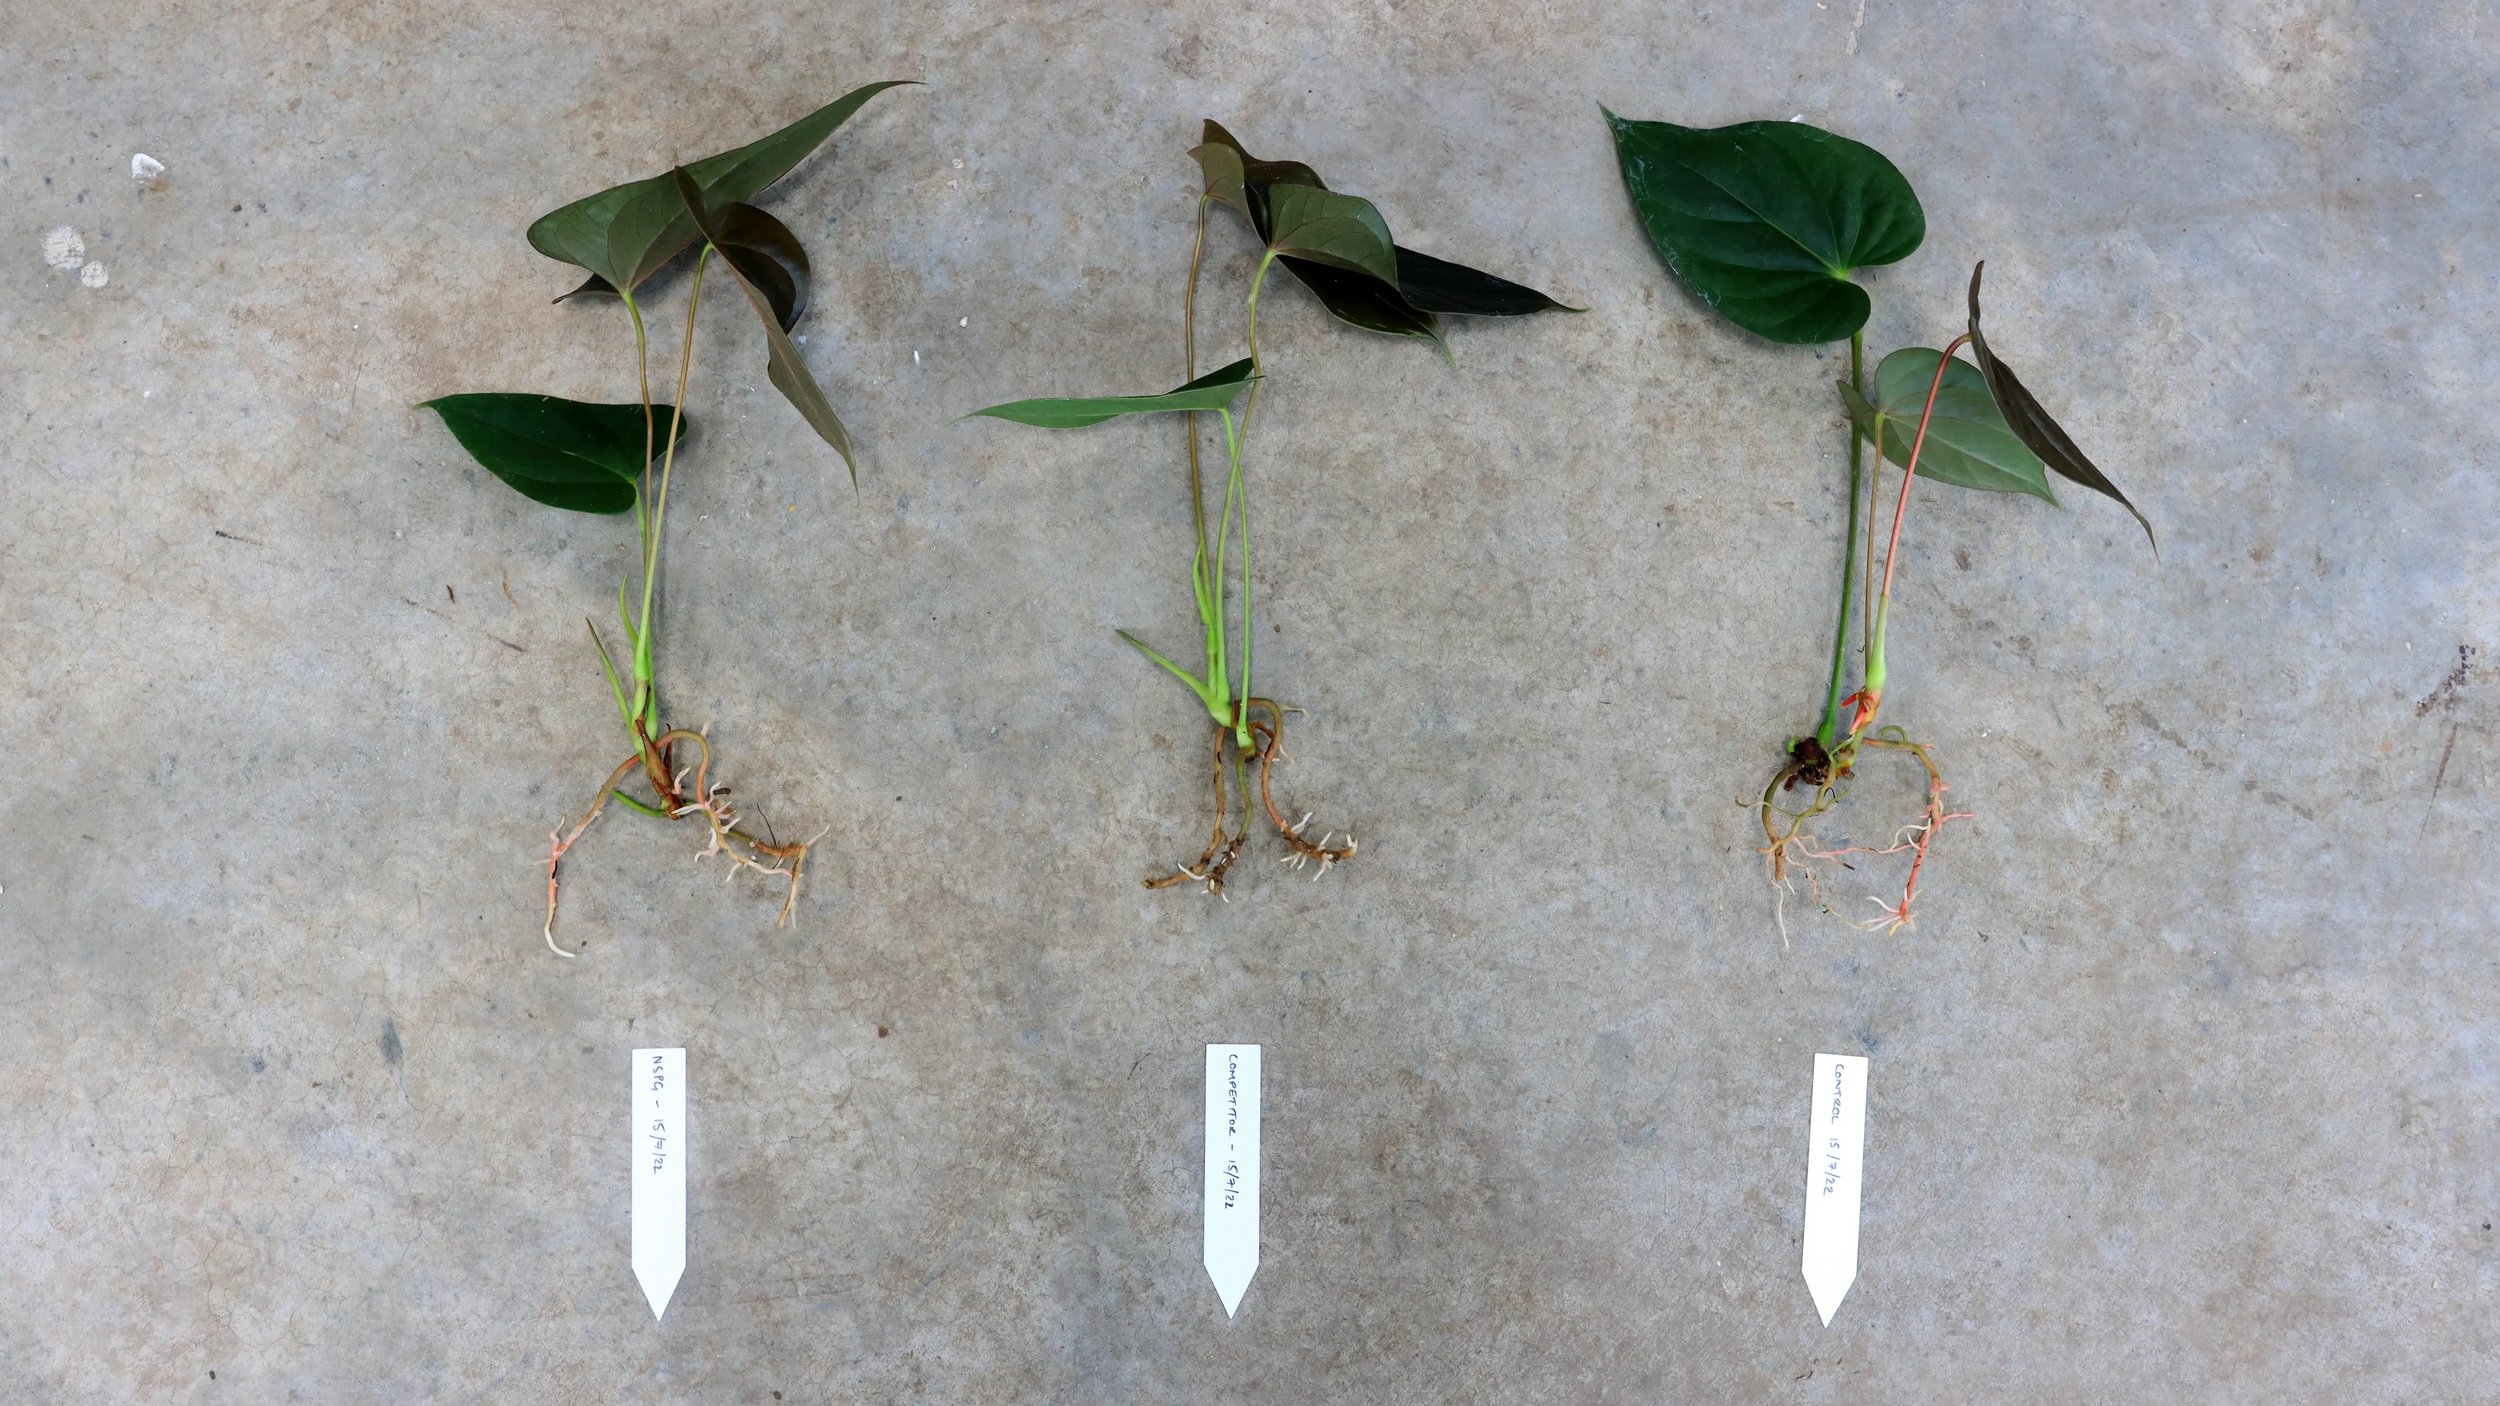
It was now time to unpot and rinse off all of the plant samples across all 3 groups. We did not remove any dead leaves or debris from any of the samples and before we took anything out of their pots. We took a group photo of all 3 containers (Left to right, NSPG, Competitor, Water (Control)). Please feel free to check out our gallery for the full before and after photos for every plant sample, but for now, here are some of our favourites!
Group Photo
Left to right: PowerGrow, Competitior, Control (water)
In addtion to observing an obvious size difference across the 3 groups, there is also a noticable difference in colour. The PowerGrow group (left) shows a much darker healthier colour than the other two groups.
While we can see that the competitor fertiliser (center) has outperformed the control group (right), we were surprised to see that the growth increase was not as much as expected.
A closer look at what’s going on
Philodendron Gloriosum - Left to right: NSPG (PowerGrow), Competitor, Control (Water)
It would appear that the PowerGrow plant sample produced much larger and healthier growth than either of the other two groups. Interestingly, the leaves of the competitor sample appear lighter in colour than the control group. There has also been some leaf death. It would seem that the control plant simply didn’t really grow at all. This was a running theme throughout the experiment.
Let’s take a look at the root system
While PowerGrow (Left) has produced more growth, the root mass has not increased at the same rate. This is because the plant has been receiving the adequate amount of nutrients and therefore has used the energy to produce new foliage rather than a larger root system.
We can also observe that the root mass of the control (right) seems to be more dense than that of the competitor fertiliser (left). This is also a result that seems to be true for most of the plant samples. See our Gallery for full details.


